売上・損益状況
(単位: 百万円)
| 2020/11 | 2021/11 | 2022/11 | 2023/11 | 2024/11 | |
|---|---|---|---|---|---|
| 実績 | 実績 | 実績 | 実績 | 実績 | |
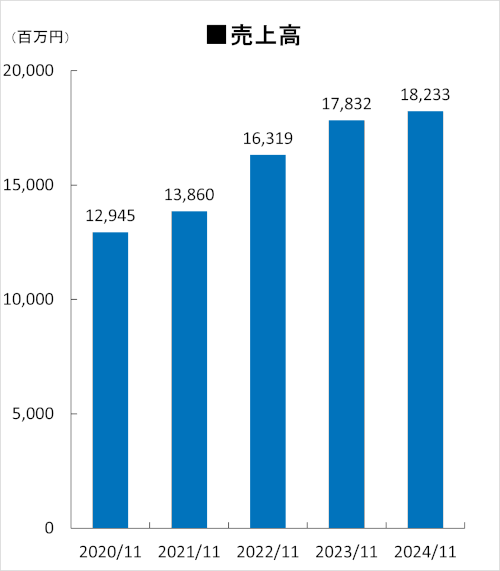
| 売上高 | 12,945 | 13,860 | 16,319 | 17,832 | 18,233 |
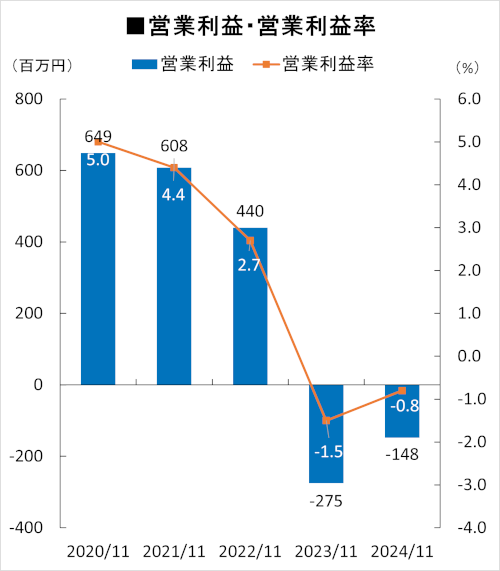
| 営業利益 | 649 | 608 | 440 | △275 | △148 |
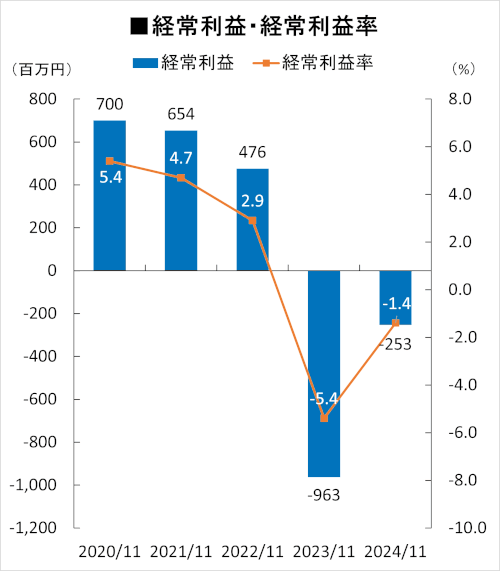
| 経常利益 | 700 | 654 | 476 | △963 | △253 |
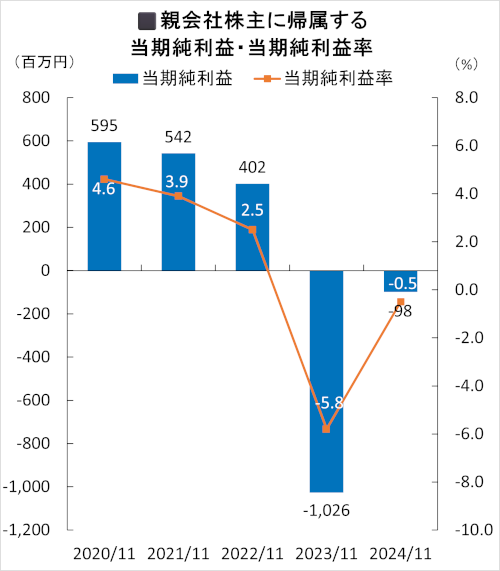
| 親会社株主に帰属する 当期純利益 | 595 | 542 | 402 | △1,026 | △98 |
収益性の指標
| 2020/11 | 2021/11 | 2022/11 | 2023/11 | 2024/11 | |
|---|---|---|---|---|---|
| 営業利益率 | 5.0% | 4.4% | 2.7% | △1.5% | △0.8% |
| 経常利益率 | 5.4% | 4.7% | 2.9% | △5.4% | △1.4% |
| 親会社株主に帰属する 当期純利益率 | 4.6% | 3.9% | 2.5% | △5.8% | △0.5% |